Fellows and Associates Salary Survey 2023: Exploring Remuneration, Flexible Working, and ED&I in the IP Industry
The anticipated results of the annual Fellows and Associates Salary Survey have recently been announced and the data proves interesting for individuals working in all areas of the intellectual property sector, employees and employers alike. The specialist IP recruitment and social media consultancy have managed the survey for the past twelve years and consider it to be one of the most comprehensive of its kind, harnessing data directly from employees as opposed to summarising general guidelines from HR departments. It not only covers base salaries but aspects of the industry which are also considered key, such as flexibility/hybrid working, equality, diversity and inclusion, and discrimination in the workplace.
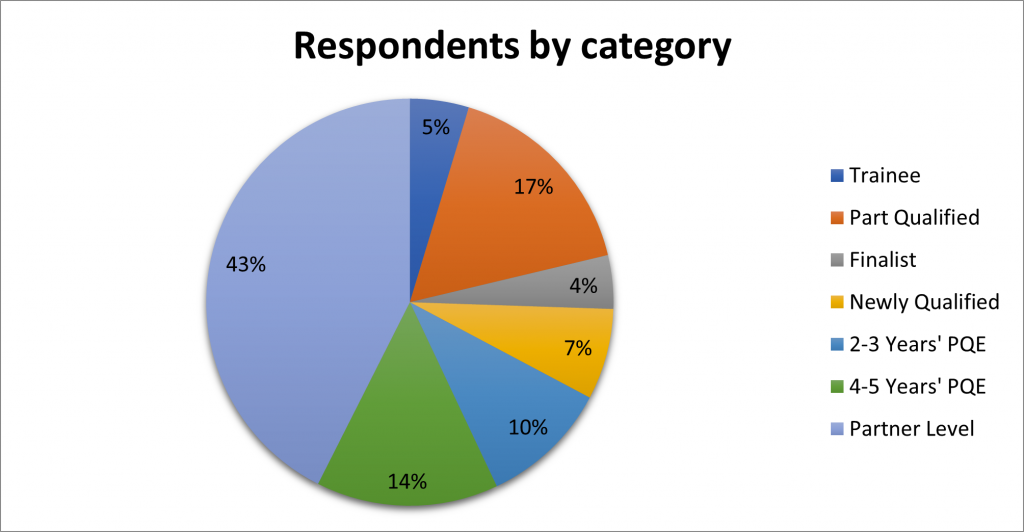
The survey was available on line for an eight-week period from May until July 2023 and was promoted across the Fellows and Associates’ website and social channels, as well as being publicised on IP Careers, CIPA and the Patent Lawyer Magazine. There was a total of 235 participants in the survey, 59% male, 37% being female, and a small percentage either declined to answer or were non-binary.
The majority of respondents were based in the UK and came from private practice (67%), with 75% being fully qualified and the rest working towards their first qualification. Of those still not qualified, nearly all received full funding for their examinations from their employer (5% needed to source elsewhere) and 54% received more than one day off for each exam taken, a significant increase from 18% from 2022.
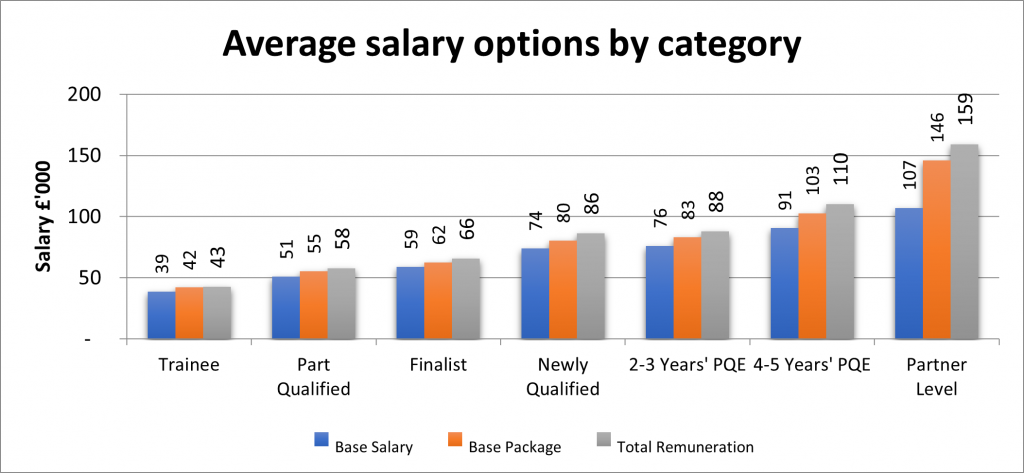
The uplift in time off received per examination may be one of the many indications we have seen in the survey, and witnessed from experience, of firms investing much more significantly in their less experienced attorneys. During the pandemic and immediately after, many if not all firms imposed a recruitment freeze particularly for some at graduate/entry level. This has meant that there are less attorneys coming through the ranks up to and just after newly qualified level. The increased time off may be a combination of firms attempting to retain their staff and also ensure they have the best chance possible at qualifying quickly. The survey showed that those in the early years of their career received a higher percentage increase in their base salary and total remuneration (ranging between 13% – 20%) compared to those a couple of years’ PQE+, potentially removing salary as a motivating factor for employees to move. The demand for attorneys a couple of years’ in is reflected in the number of positions Fellows and Associates have been recruiting over recent times. It is very much a candidate led market with movers having multiple options (sector and location dependent of course), and this is reflected in the number of attorneys that have moved positions within the last twelve months, but have not yet qualified, having doubled to 18% from 9% in 2022.
Remuneration was broken down to include base salary, base salary plus benefits such as pension, private healthcare etc., and total remuneration (base package plus bonus/profit share).
There were no specific regions within the UK that indicated higher earning potential, excluding some nominal spikes that would need to be further explored due to other influencing factors. This is not surprising given that the industry on the whole is international in nature and firms can serve clients from any location. Again, when looking at the average base and total remuneration package by specialism there is not much deviation. There has been higher demand over recent months within certain technical specialisms, such as biotechnology, which may have caused average earnings to be higher if firms are offering more in order to secure new hires in a candidate led/candidate short market.
| Average base package by specialism (total remuneration package) | |||||||
| GBP £’000 | Trainee | Part Qualified | Finalist | Newly Qualified | 2-3 Years’ PQE | 4-5 Years’ PQE | Partner Level |
| Biotechnology | 43.1(44.4) | 58.6 (60.6) |
65.3 (70.0) |
90.5 (103.1) |
79.2 (85.6) |
104.9 (110.0) |
153.7 (168.5) |
| Chem/Pharma | 40.6 (41.1) |
67.4 (68.6) |
67.0 (68.0) |
72.7 (75.0) |
104.0 (115.2) |
113.0 (125.6) |
157.7 (174.6) |
| Electronics | 41.3 (42.3) |
52.8 (58.0) |
63.8 (64.6) |
79.3 (80.3) |
83.3 (86.9) |
101.9 (109.9) |
140.9 (151.4) |
| Engineering | 42.3 (42.6) |
45.6 (47.0) |
58.5 (62.2) |
74.3 (77.3) |
85.3 (90.1) |
96.3 (101.4) |
141.8 (156.4) |
| Trademarks | 38.8 (38.8) |
46.3 (50.1) |
70.0 (75.0) |
142.6 (147.2) |
|||
As always, we include a rough guide on salaries that could be achieved on moving positions. This is anecdotal evidence and informed deliberation from positions Fellows and Associates have recently recruited, and not on data collected from survey respondents. Statistically there are fewer roles for trademark attorneys than patent attorneys, making it difficult to collect the most accurate data. The salaries achieved in the roles we do recruit are normally individually prescribed by a number of factors such as type of firm, client requirements, and attorney skillset.
| Salary range achievable on moving positions | |||||||
| GBP £’ 000 | Trainee | Part Qualified | Finalist | Newly Qualified | 2-3 Years’ PQE | 4-5 Years’ PQE | Partner Level |
| Patent Attorney | 35-40 | 48-52 | 55-60 | 70-75 | 82-90 | 90-115 | 125-150 |
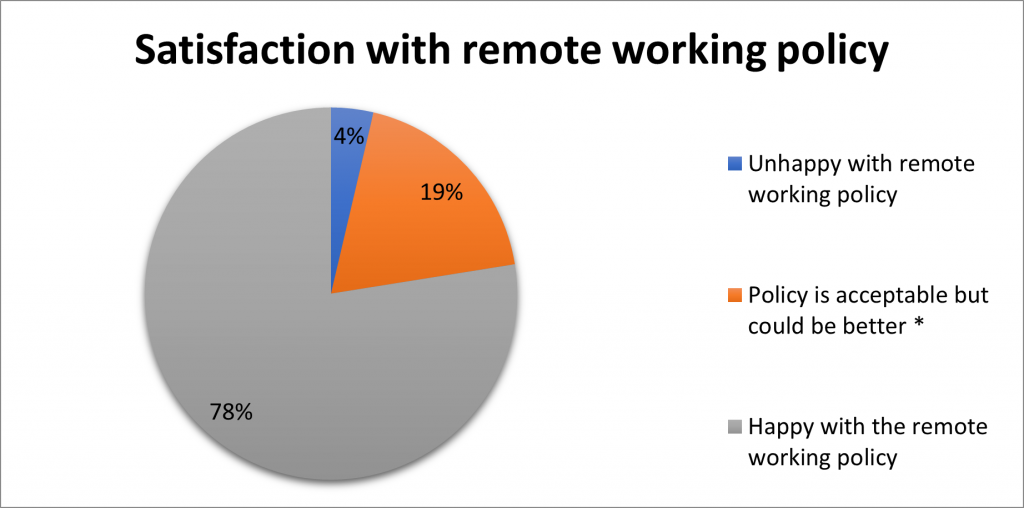
The survey explored flexible working and it seems that there has been some improvement in satisfaction made when it comes to firms’ flexible working policies – 12% were dissatisfied in 2022 compared to 4% in 2023. One factor that may have contributed to this is the drop in firms requiring employees to be in the office 5 days a week. This was 24% in 2022 compared to 4% in 2023, with only 2% of firms being exclusively office based.
Quite possibly one of the most crucial sections of the survey relates to ED&I, social mobility, and discrimination. Of the respondents experiencing discrimination 42% witnessed more than one type directed at themselves or at others. This is a slight improvement on 52% in 2022 and 63% in 2021, indicating a positive albeit slight decrease over recent years. We would like to hope that the introduction, and continuing growth and development of, initiatives such as IP Inclusive and our inclusion of such statistics in our salary survey in recent years has shed light on previously sheltered issues within the industry.
Interestingly only the slight majority were female (56%) indicating that discrimination was, somewhat, equally experienced by male and female participants – with around 2% identifying as non-binary. As part of the survey, respondents were asked to comment on they felt they were supported by their firm and whilst only 25% did, there was a single theme from the overwhelming majority – that HR and Management were either ineffectual / unsupportive or, worse, actively participating in the discrimination and/or bullying.
We also explored the issue of social mobility and found that out of a score of 1 (a poor approach) to 10 (a very well-defined and executed approach), the overall weighted outcome was 6.74. This shows that there is significant room for improvement in the IP industry’s approach and execution when it comes to social mobility. Those from an ethnic minority gave an even lower score of 5.94, further illustrating that there is much that needs to be done. Firms’ attitudes to equality and diversity were slightly better with an overall weighted score of 7.28, but again with ethnic minorities scoring lower with 5.84 and female respondents scoring 6.82. The results show that although attitudes towards important topics such as social mobility and ED&I are improving, there is still significant opportunity to push positive change.
We hope that the survey, alongside other fantastic industry initiatives, helps highlight areas for improvement and that it continues to be regarded as an important tool in aiding conversation on how these changes can be made. The full salary survey results can be found at www.salarysurveyresults.com. We welcome any comments or ideas for improvements, which you can email to us.
Phillipa Holland, Principal Consultant – Fellows and Associates


